Data Storytelling and Visualisation Using Power BI
Ready to turn numbers into narratives that captivate and convince? Our Data Storytelling and Visualisation Using Power BI course is your hands-on guide to making data not just informative, but unforgettable.
Data Storytelling and Visualisation Using Power BI Course
$0.00 ($1,471.00 bef. Subsidy)
-$945.00 (Subsidy)*
-$526.50 (SFC Credits)*
*This is a projected amount, should you qualify for these.
Classroom Learning
5 Days, 7pm to 10pm

Looking for 90% Subsidy?
View Corporate Training
why choose Data Storytelling and Visualisation Using Power BI?
Our Data Storytelling and Visualisation Using Power BI course equips you with the skills to turn complex data into clear, impactful stories. With hands-on practice in building dashboards and crafting data-driven narratives, you'll confidently present insights that influence decisions and drive results.
2-Day Classroom Learning
Course ID: TGS-2024042293
Who is This Course For?


*Learners need to possess basic information and communication technology (ICT) skills. There are no *pre-requisites for professionals who would like to pursue the certification course.
Core Competencies You'll Gain:
Data analysis
Identifying trends and target markets
Knowledge of Power BI
Integrating well with Microsoft tools
Data Storytelling and Visualisation Using Power BI Course Details
Our Data Storytelling and Visualisation Using Power BI course goes beyond charts and dashboards by combining practical frameworks with real-world business scenarios. You’ll explore key topics such as crafting impactful data stories, building dynamic dashboards, and translating complex data into clear, actionable insights—all delivered through interactive exercises, hands-on projects, and expert guidance. This isn’t just another data course; it’s your gateway to mastering the art of visual communication, influencing decisions with confidence, and turning data into a powerful storytelling tool for business success.
Classroom Learning
@ Holiday Inn (Orchard City Centre)
@ Concorde Hotel
5 Days,
7.00pm to 10.00pm

Course Fee & Subsidies
Singaporeans aged
40 and above
Course Fee
$1,471.50
70% Subsidy
-$945.00
SFC Credits
-$526.50
Amount to Pay
$0
Singaporeans aged
below 40
Course Fee
$1,471.50
50% Subsidy
-$675.00
SFC Credits
-$796.50
Amount to Pay
$0
Permanent
Residents
Course Fee
$1,471.50
50% Subsidy
-$675.00
Amount to Pay
$796.50
*Please note that a $20 non-refundable and non-claimable registration fee applies for all course registrations
*Prices quoted are inclusive of GST at the prevailing rate
SkillsFuture Credits: All Singaporeans aged 25 years old and above can use their SkillsFuture Credits to fully offset the remaining fees.
UTAP Support: In addition, NTUC members can utilize UTAP to offset 50% of remaining fees (capped up to $500 per year)
Course Dates for Data Storytelling and Visualisation Using Power BI
No schedule dates available for this course.
Meet Your Trainers

Goh Cheng Hau, Gary
Gary is a seasoned data analyst with extensive experience working in leading software and biotechnology companies. As a CPE-Registered adjunct lecturer, he has taught and examined diploma to postgraduate courses across multiple private education institutions. Gary holds an MBA in Finance, a BSc in Finance, and a Specialist Diploma in Big Data Analytics. His professional certifications include the Microsoft Professional Program for Data Science and the Advanced Certificate in Training and Assessment (ACTA).
Data Storytelling and Visualisation Using Power BI Course Outline
- Understanding the importance of data visualization and the role of colors effective communication and interpretation of information
- What are different data visualization tools and their appropriate usage scenarios is crucial for effectively communicating insights and patterns found within data
- What are the questions to consider in a dashboard review
- What is the importance of data analysis
- What is the significance of Power BI and what are the key components that make up Power BI
- What is the difference between Power BI desktop and service
- An overview of DAX and exploring the Power BI desktop
- Guide learners to learn features such as how to generating tables using calculated tables, create calculated columns, and how to format visualization
- Guide learners on the features and steps needed to create a final dashboard
- Understanding the significance of choosing the appropriate visualization and effectively organizing your data structure.
- Provide guidance to learners in a practical activity that involves creating and formatting a report.
- Provide instructional support to learners in the process of creating sales forecasts and understanding how to interpret the resulting report.
- What is business intelligence and how does data visualisation boost Business Intelligence’s value
13 capabilities on how Garner can evaluate BI tool - Define what a dashboard is and explain the concepts of metrics and Key Performance Indicators (KPIs)
- Identify different types of performance indicators
- Understand the components and objectives of various metrics
- Apply best practices for visualizing categorical and spatial data in dashboards
- Learners will be guided on designing their own dashboard and successfully create a sample dashboard as preparation for capstone assessment
- Course Evaluation
- 12 Multiple Choice Question
- Capstone Project
Course materials will be provided in soft copy (digital format) as part of our eco-friendly and sustainability effort. Printed hard copies are available upon request. For any special requests (e.g., printed materials or accessibility needs), please inform us in advance.
Check Out Other Popular Courses
3 Easy Steps to Enroll
1
choose desired
course schedule
Choose convenient classes on evenings or weekends.
2
subsidy
Calculation
Fill out the form to calculate your government subsidies.
3
register
Online
Secure your place with a deposit and start today.
achieve mastery in Data Storytelling and Visualisation Using Power BI today

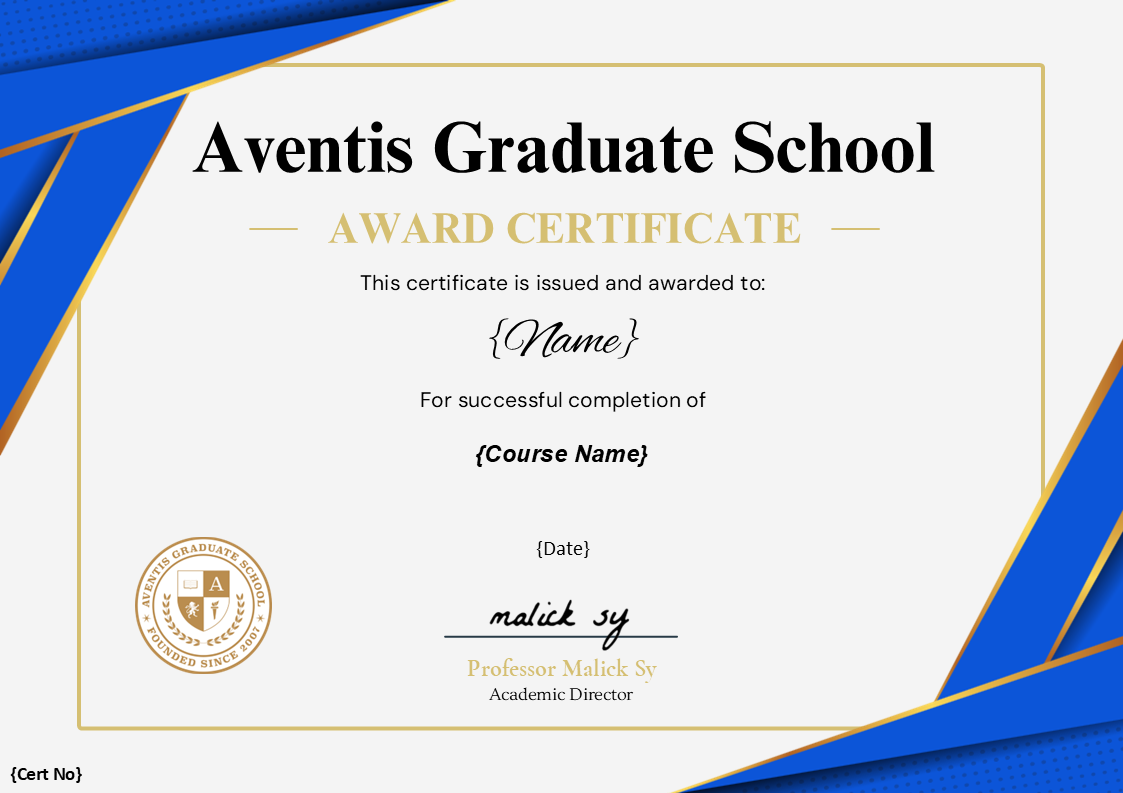
Upon successfully completing the Data Storytelling and Visualisation Using Power BI course at Aventis Learning Group, you will receive an IBF-accredited certification recognized by employers in Singapore. This certification serves as a testament to your expertise in digital assets, helping you showcase your skills to potential employers and professional networks.
Bonus Tip: Display your certification on LinkedIn to strengthen your professional profile and capture the attention of potential employers.
FAQ
Power BI is a business analytics and data visualization tool developed by Microsoft. It enables users to connect to various data sources, transform and model data, and create interactive dashboards and reports that provide real-time insights. Designed for both technical and non-technical users, Power BI has an intuitive interface that’s familiar to those who use Excel, making it easy to learn and use. With its ability to turn complex data into clear, visually engaging reports, Power BI empowers organizations to make informed, data-driven decisions efficiently.
Yes, up to 70% funding support is available from The Institute of Banking & Finance (IBF) for our IBF-accredited programmes:
The IBF Standards Training Scheme ("IBF-STS") offers funding for training and assessment programmes accredited under the Skills Framework for Financial Services.
Eligible Singaporeans and PRs enrolled in our IBF-accredited courses can receive funding support through IBF-STS, subject to fulfilling all eligibility requirements.Yes. For self-sponsored Singaporeans aged 25 years old and above, you can use your SkillsFuture Credit to offset the remaining course fees after WSQ funding.
To check your SkillsFuture credit balance, please follow these steps:
- Go to https://myskillsfuture.gov.sg
- Click on ‘Submit SkillsFuture Credit Claims’
- Login with your SingPass
- Click on the arrow (>) at the top right hand corner. You will be able to see a drop-down list of your Available SkillsFuture Credits.
After you have registered for a course, an Aventis representative will reach out to guide you with the SkillsFuture Credits
*Please note that our courses are not eligible for “Additional SkillsFuture Credit (Mid-Career Support)’. You will only be able to use available credits from ‘SkillsFuture Credit’ and ‘One-off SkillsFuture Credit Top-Up’.Yes, all our courses are eligible for Union Training Assistance Programme (UTAP) Funding. NTUC Union members can use UTAP to offset 50% of unfunded course fees (capped at $500 per year).
This claim must be done after completion of the course. Please refer to the UTAP FAQ for more information.
Yes, both can be utilized concurrently. UTAP claims are processed after SkillsFuture Credits have been applied.
Illustrative Example:
- Total Course Fee: $1,000
- IBF Subsidy (70%): $700
- Remaining Fee: $300
- SkillsFuture Credit Applied: $200
- Out-of-Pocket Expense: $100
- UTAP Reimbursement (50% of $100): $50
The IBF funding support works on a nett fee model. This means that the subsidy is applied upfront, and you will only need to pay the balance course fees after the subsidy. For example, if you are eligible for 70% subsidy, you only need to pay the remaining 30% upfront.
To be eligible, you’ll have to meet the following prerequisites.
For Self-Sponsored:
All Singaporeans or Singapore Permanent Residents (PRs) that are physically based in Singapore and successfully complete the course will be eligible.
- Be a Singaporean Citizen or PR based in Singapore
- Minimum of 75% attendance (this means that you must attend at least 6 out of 7 lessons)
- Pass the final assessment
Any balance course fees can be offset using your SkillsFuture Credits & NTUC UTAP funding.
For Company-Sponsored:
- Be from Financial Institutions that are regulated by the Monetary Authority of Singapore (MAS) (either licensed / exempted from licensing) or Fintech companies that are registered with the Singapore Fintech Association.
- Be a Singaporean Citizen or PR physically based in Singapore
- Minimum of 75% attendance (this means that you must attend at least 6 out of 7 lessons)
- Pass the final assessment
A laptop is required for this course. No special software or other hardware is required for this course participation.
 Supercharge Your Career with Generative AI & ChatGPT!
